PROPERTY-CLASS BENCHMARKS
Cost segregation, by property class.
Every commercial property type has a distinct reclassification profile. Office reclassifies in the mid-20s; retail and medical office reclassify into the low-30s; hospitality and self-storage clear 30% routinely. Pick a property class to see the engineered benchmarks and three representative analyses across eight commercial property types.
01 · BENCHMARK ATLAS |
Reclassification rates by property class · engine-modeled
UPDATED 2026-05-11 · LIVE

01 / — n = Typical market range; modeled on the industrial library plus process and refrigeration component sets
Agricultural & Food Processing Facilities
%
MEDIAN
20-45%P50

02 / — n = Engine-modeled across standardized dealership configurations
Auto Dealerships
22%
MEDIAN
10-35%P50

03 / — n = Typical market range; modeled on the auto dealership library with internal technical review & QC
Auto Service & Collision Centers
%
MEDIAN
18-38%P50

04 / — n = Engine-modeled across standardized branch configurations
Bank Branches
22%
MEDIAN
15-32%P50

05 / — n = Typical market range; modeled on the restaurant component library with internal technical review & QC
Bars & Breweries
%
MEDIAN
20-40%P50

06 / — n = Typical market range; modeled on the retail component library with internal technical review & QC
Big Box Retail
%
MEDIAN
12-28%P50

07 / — n = Typical market range; engineer-scoped by proposal
Cannabis Cultivation & Retail
%
MEDIAN
25-50%P50

08 / — n = Engine-modeled across standardized car-wash configurations
Car Washes
48%
MEDIAN
25-60%P50

09 / — n = Typical market range; engineer-scoped by proposal
Churches & Religious Facilities
%
MEDIAN
8-22%P50

10 / — n = Typical market range; modeled on the warehouse library plus the refrigeration component set
Cold Storage Facilities
%
MEDIAN
20-40%P50

11 / — n = Engineer-scoped by proposal; 38-60% is the QC review envelope
Data Centers
%
MEDIAN
38-60%P50

12 / — n = Engine-modeled, bare suite to fully equipped
Dental Practices
19.9%
MEDIAN
17-22%P50

13 / — n = Typical market range; modeled on the warehouse component library with internal technical review & QC
Distribution Centers
%
MEDIAN
12-28%P50

14 / — n = Typical market range; engineer-scoped by proposal
Entertainment Venues
%
MEDIAN
20-40%P50

15 / — n = Engine-modeled across standardized fitness configurations
Fitness & Gym Facilities
20%
MEDIAN
10-35%P50

16 / — n = Typical market range; engineer-scoped by proposal
Funeral Homes
%
MEDIAN
12-28%P50

17 / — n = Engine-modeled across standardized fuel/convenience configurations
Gas Stations & Convenience Stores
24%
MEDIAN
10-38%P50

18 / — n = Typical market range; engineer-scoped by proposal
Golf & Country Clubs
%
MEDIAN
20-40%P50

19 / — n = Typical market range; modeled on the retail library plus the refrigeration component set
Grocery Stores
%
MEDIAN
20-38%P50
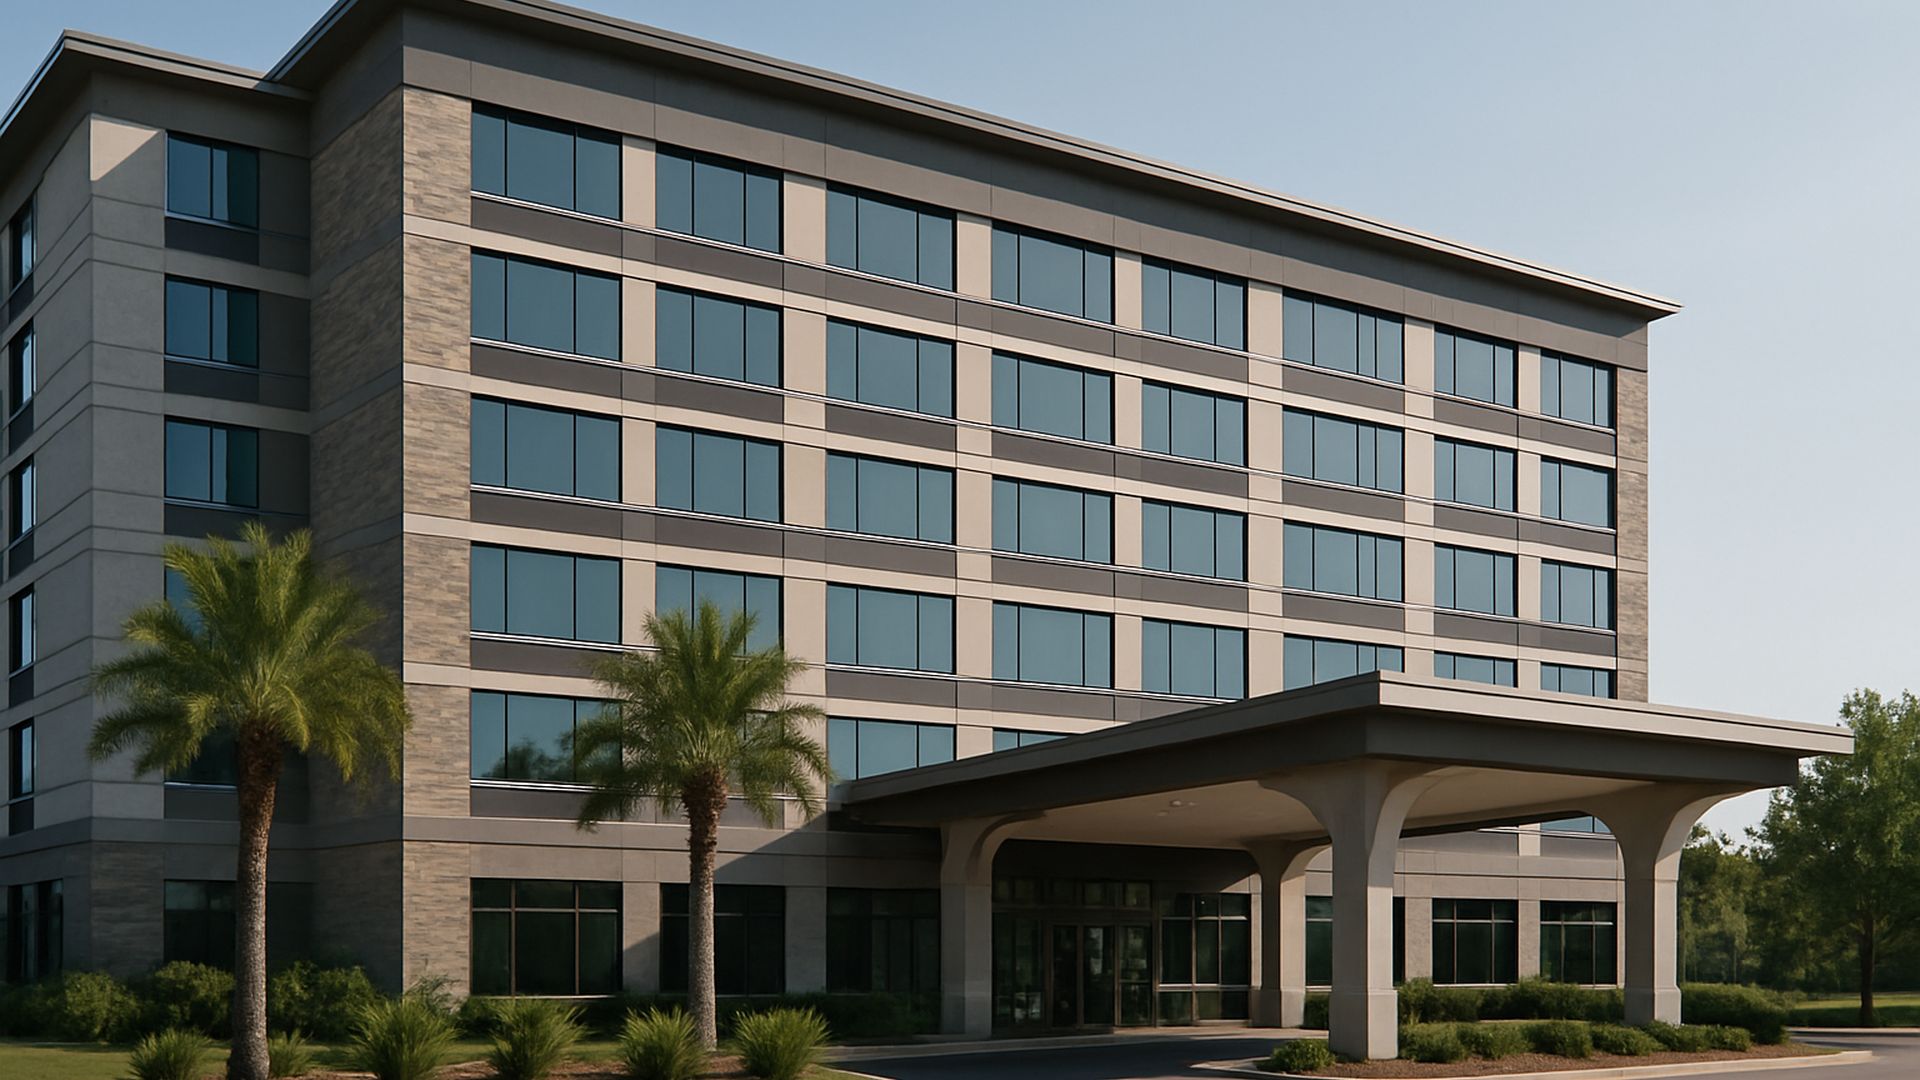
20 / HOS n = Industry sources (AICPA, IRS ATG)
Hospitality
30%
MEDIAN
26-34%P50

21 / — n = Typical market range; engineer-scoped by proposal
Hospitals
%
MEDIAN
15-32%P50
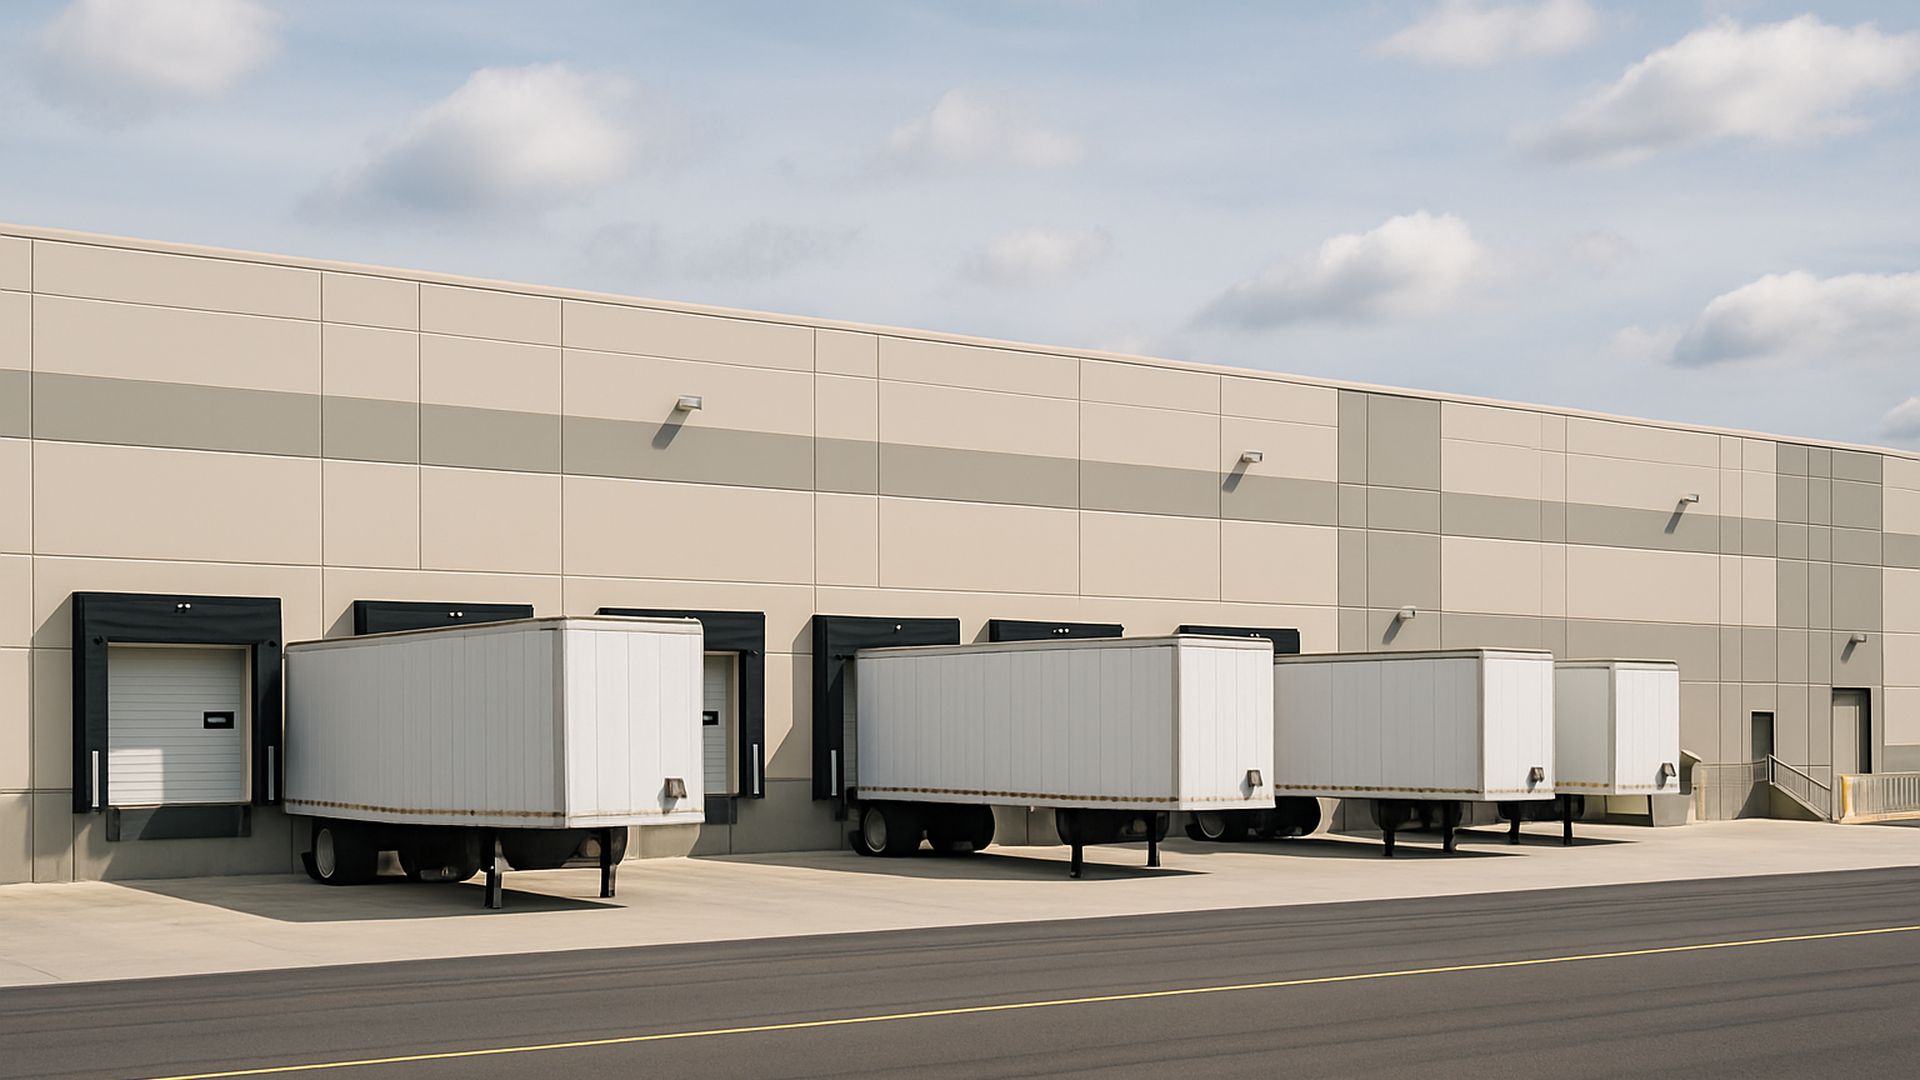
22 / IND n = Engine-modeled across standardized configurations
Industrial
20.4%
MEDIAN
20-24%P50

23 / — n = Engine-modeled central; 6-38% is the QC review envelope
Manufacturing
14%
MEDIAN
6-38%P50

24 / — n = Typical market range; engineer-scoped by proposal
Marinas
%
MEDIAN
25-45%P50
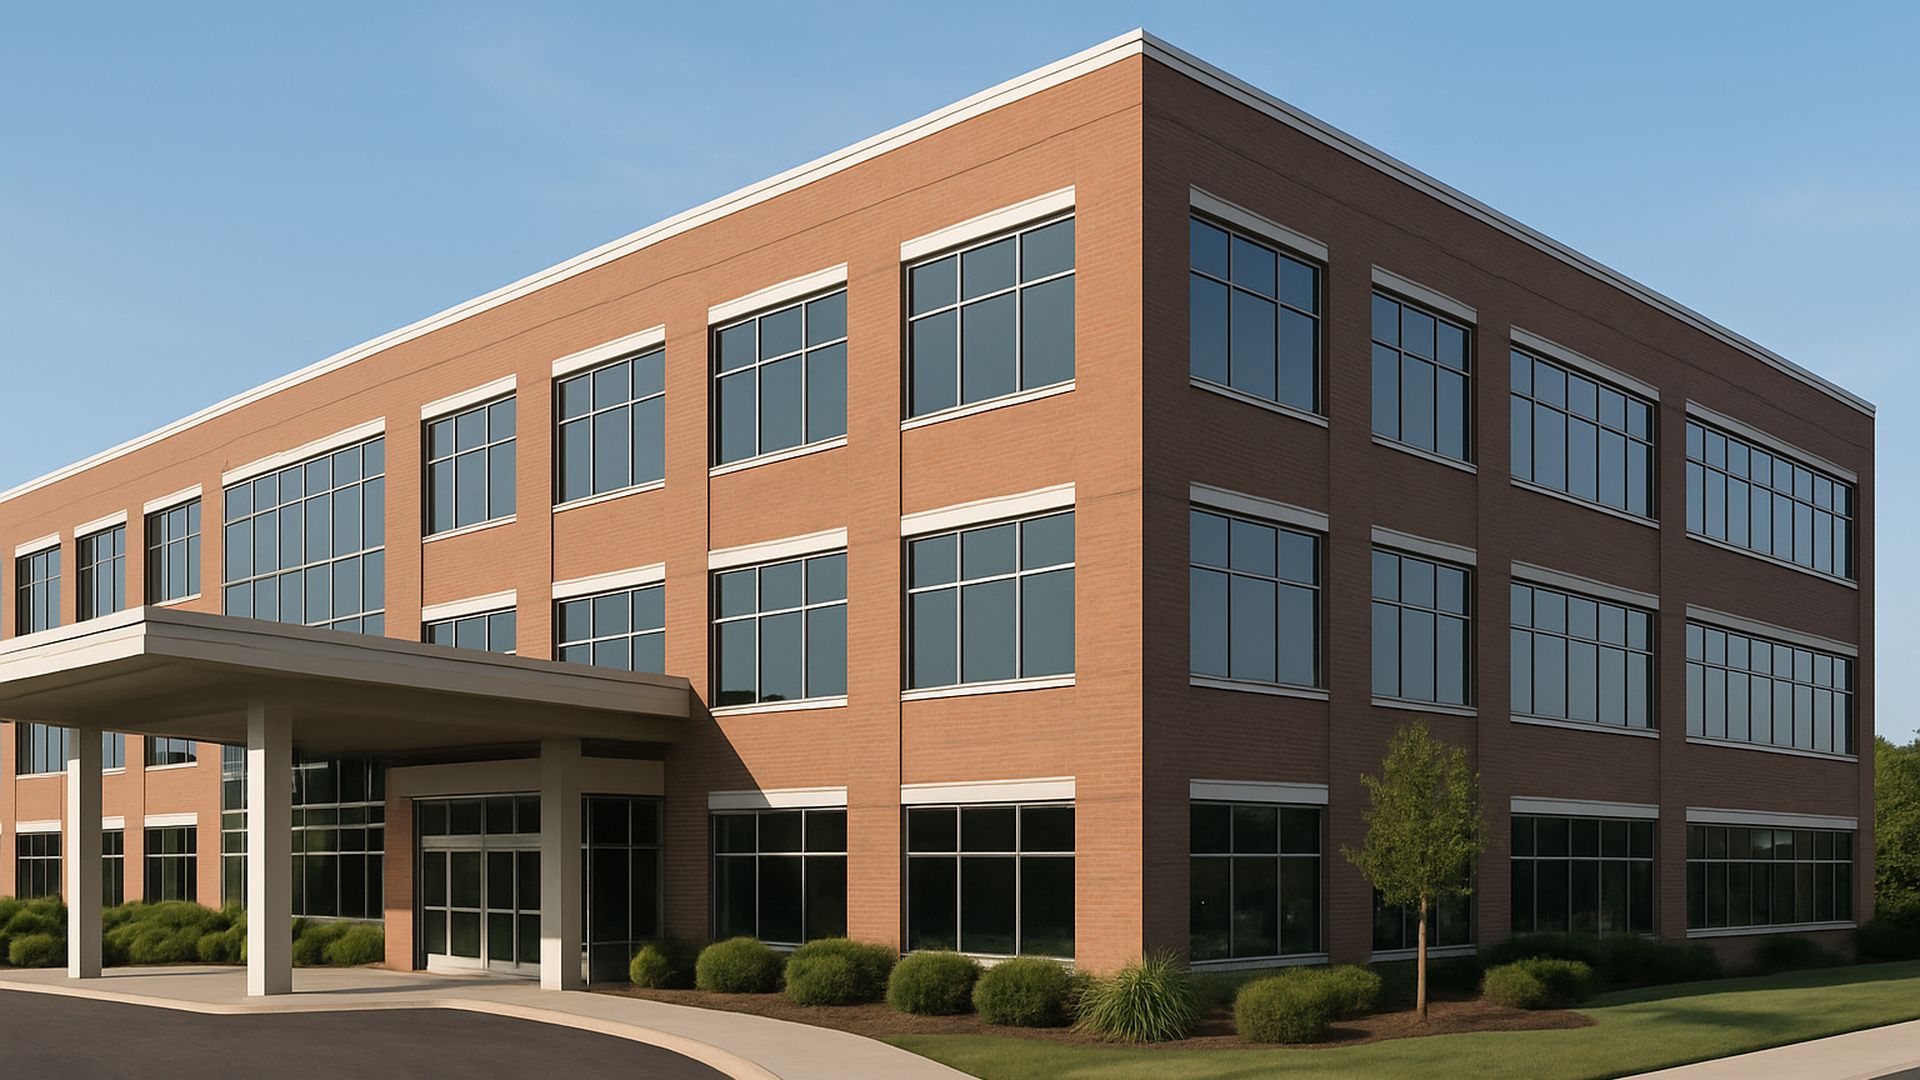
25 / MED n = Engine-modeled across standardized configurations
Medical Office
32.9%
MEDIAN
31-34%P50

26 / MIX n = Engine-modeled central; 5-32% is the QC review envelope
Mixed-Use
12%
MEDIAN
5-32%P50
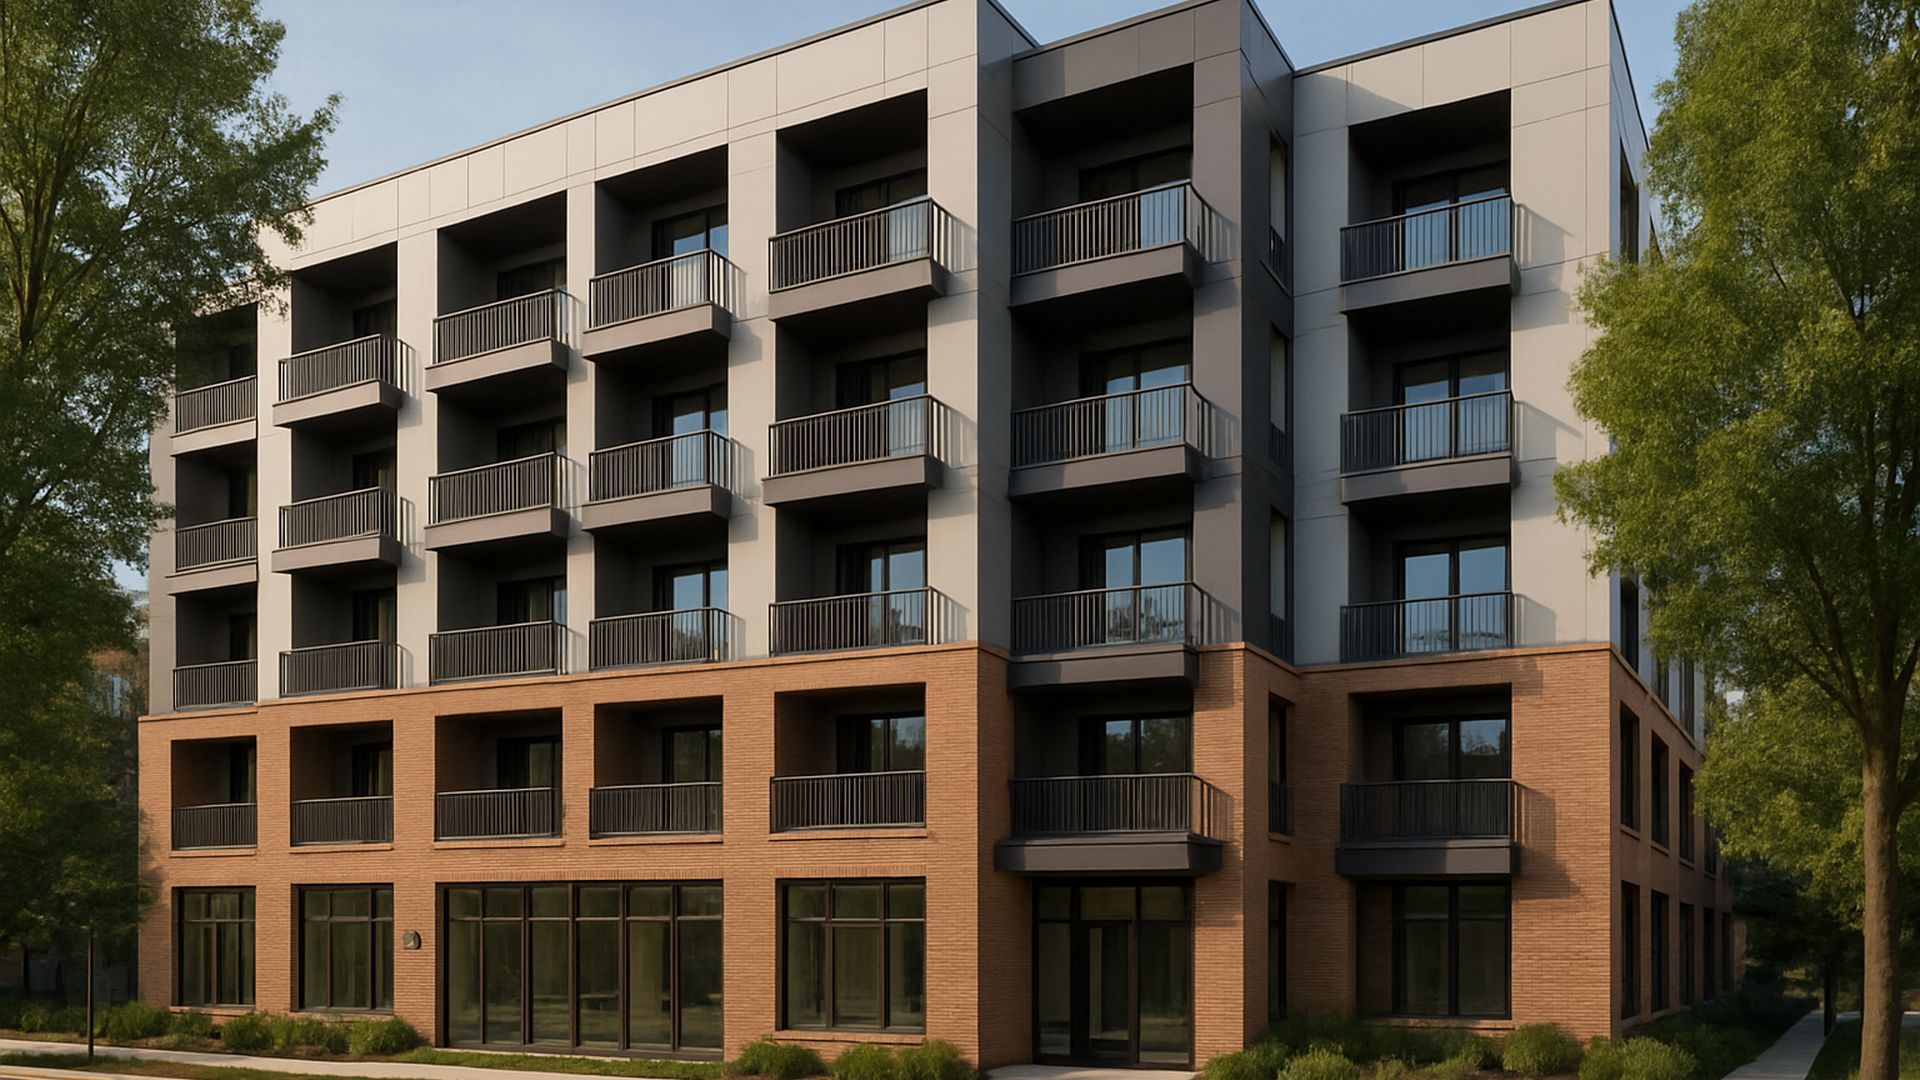
27 / MF5 n = Engine-modeled across standardized configurations
Multifamily (5+ Units)
17.2%
MEDIAN
17-18%P50
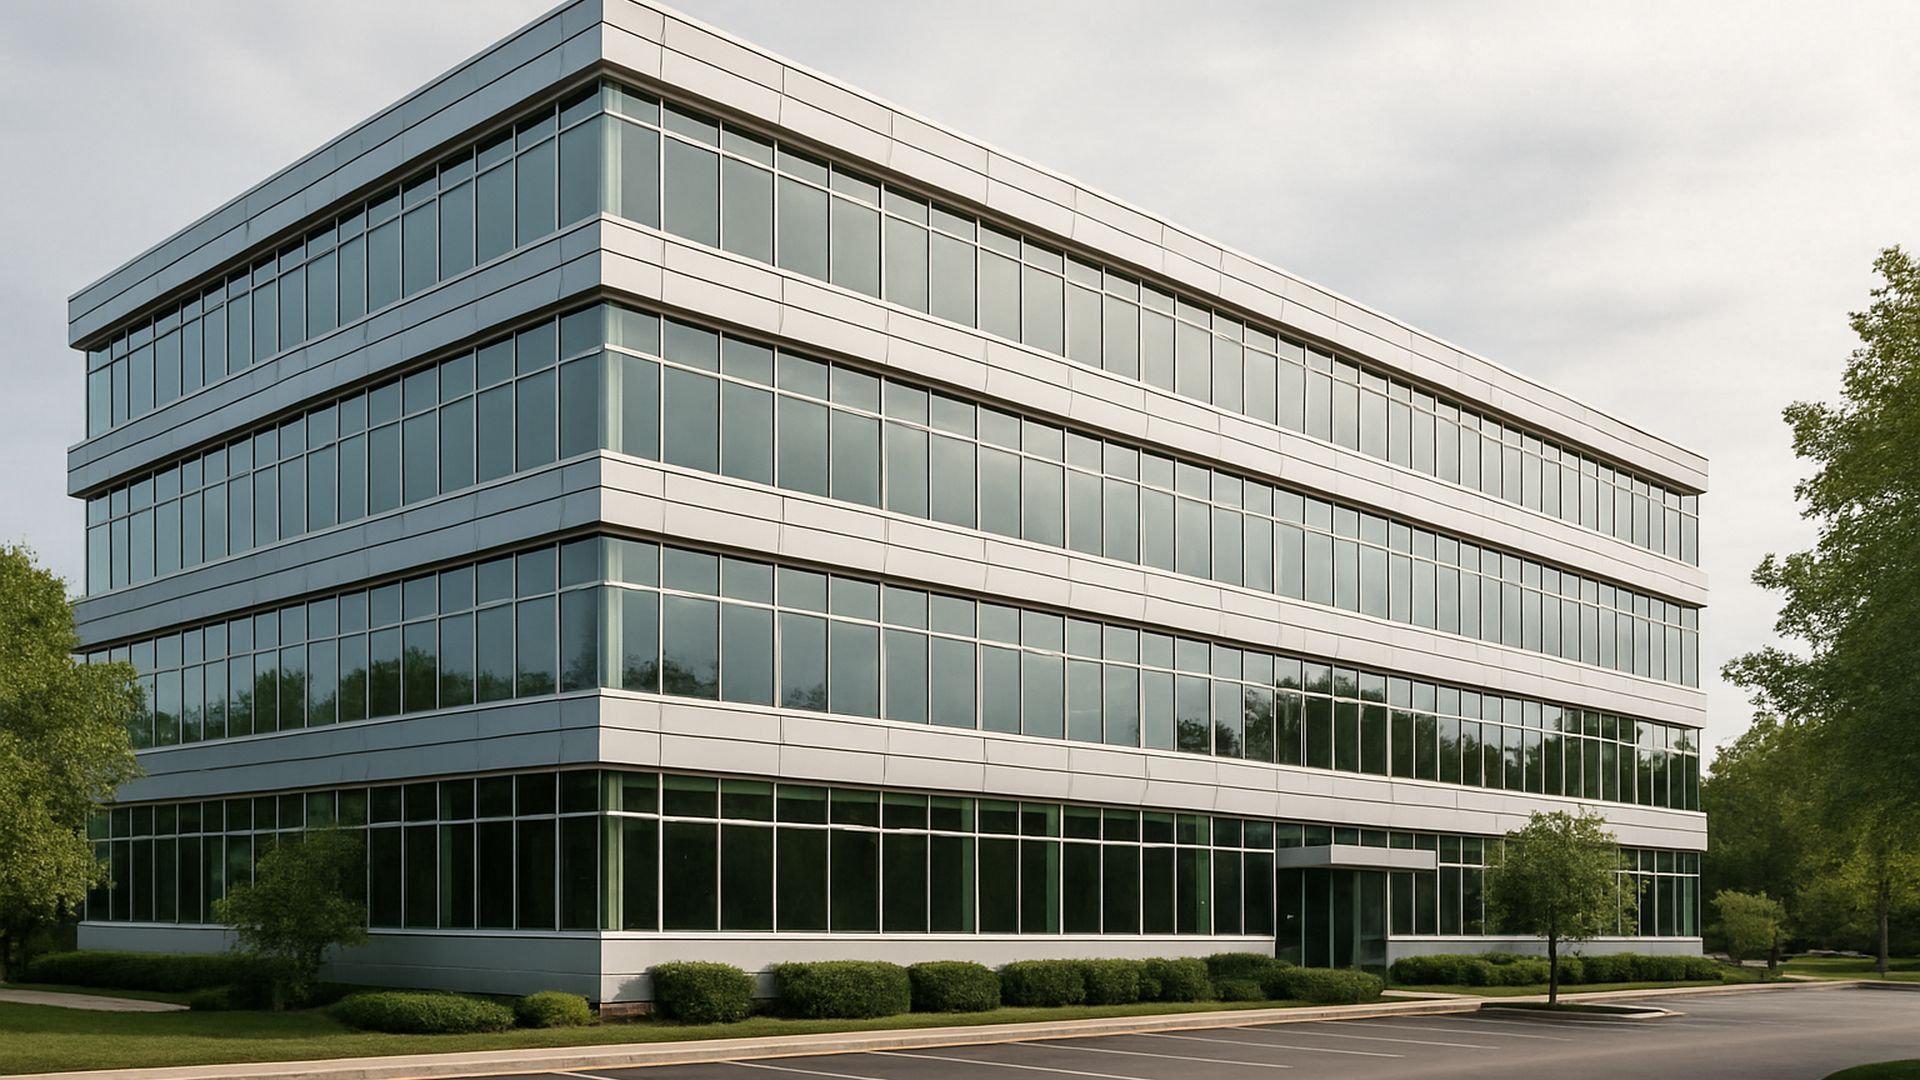
28 / OFF n = Engine-modeled across standardized configurations
Office
27.6%
MEDIAN
25-29%P50

29 / — n = Typical market range; engineer-scoped by proposal
Parking Structures
%
MEDIAN
8-20%P50

30 / — n = Typical market range; modeled on the restaurant component library with internal technical review & QC
QSR & Drive-Thru Restaurants
%
MEDIAN
22-42%P50
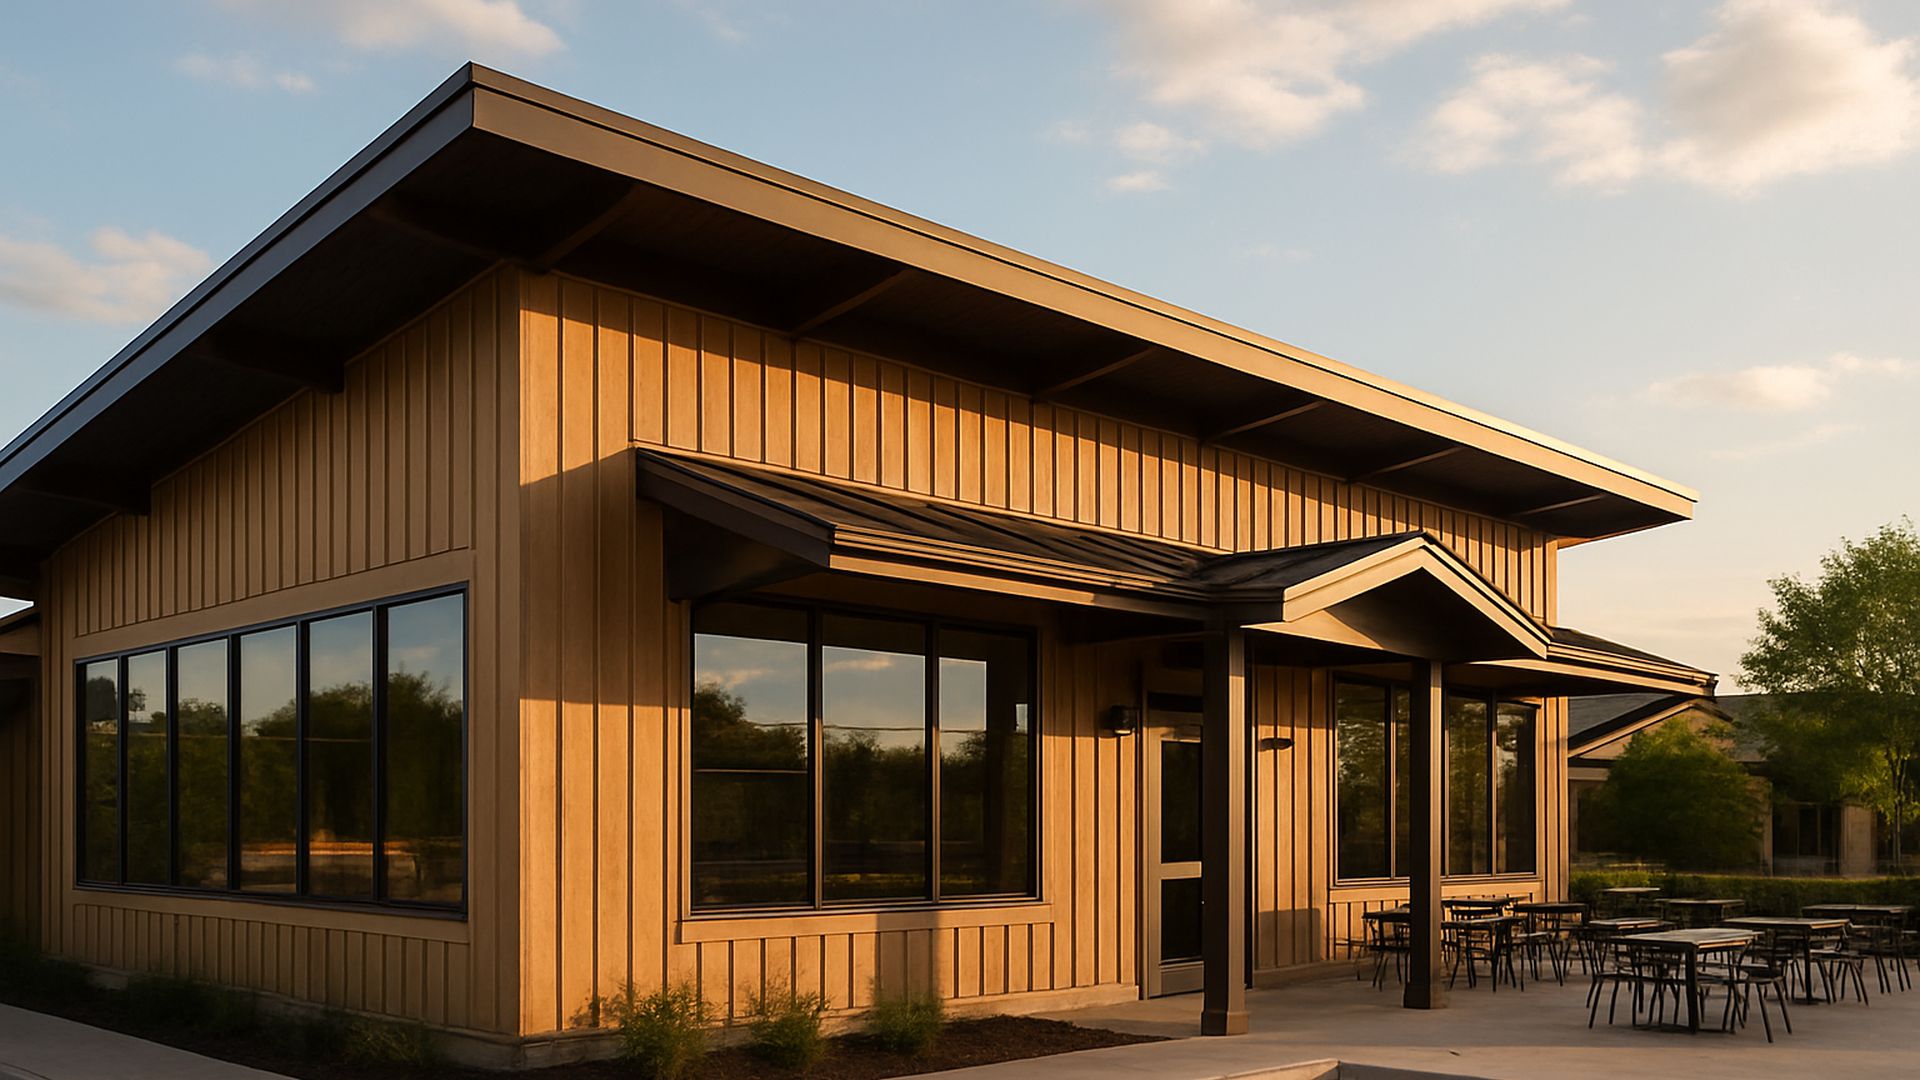
31 / RST n = Engine-modeled across standardized configurations
Restaurant
30%
MEDIAN
29-31%P50
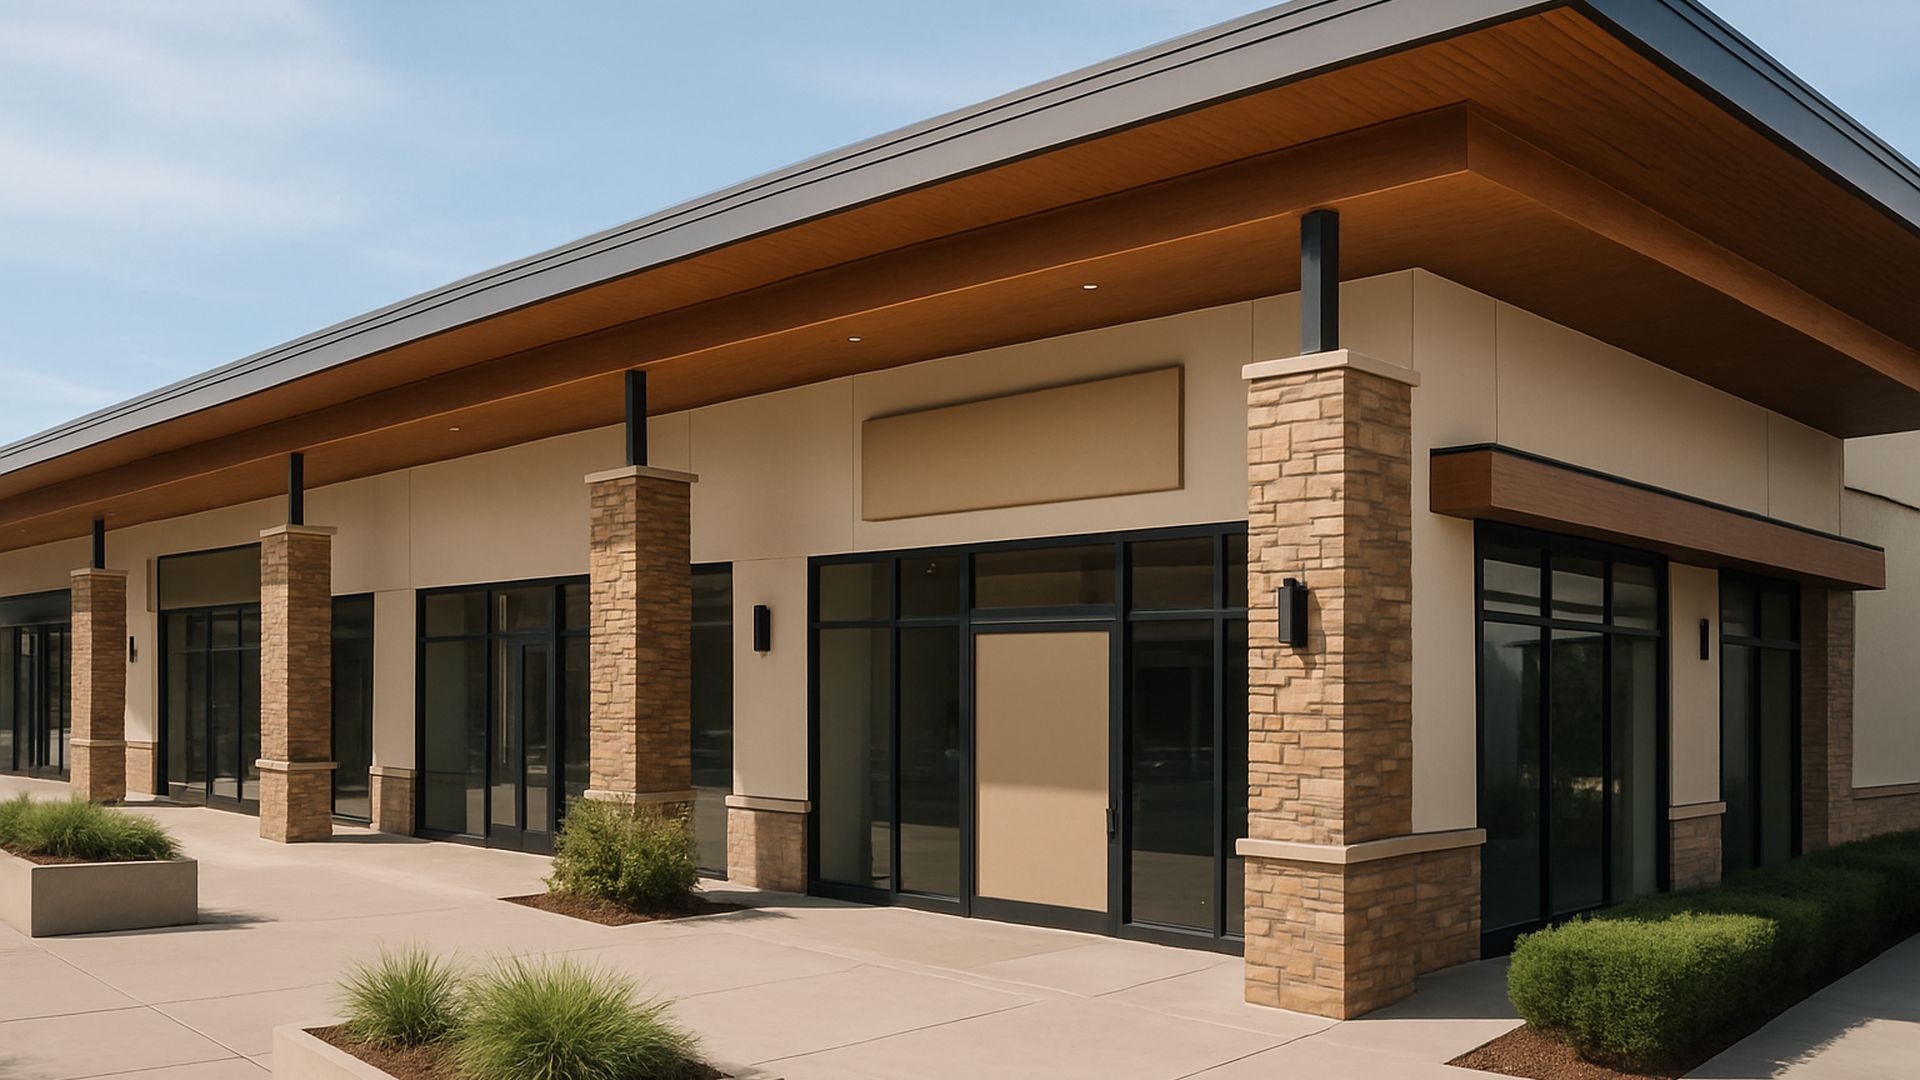
32 / RTL n = Engine-modeled across standardized configurations
Retail
32.2%
MEDIAN
31-33%P50

33 / — n = Typical market range; engineer-scoped by proposal
Schools & Childcare Centers
%
MEDIAN
10-25%P50
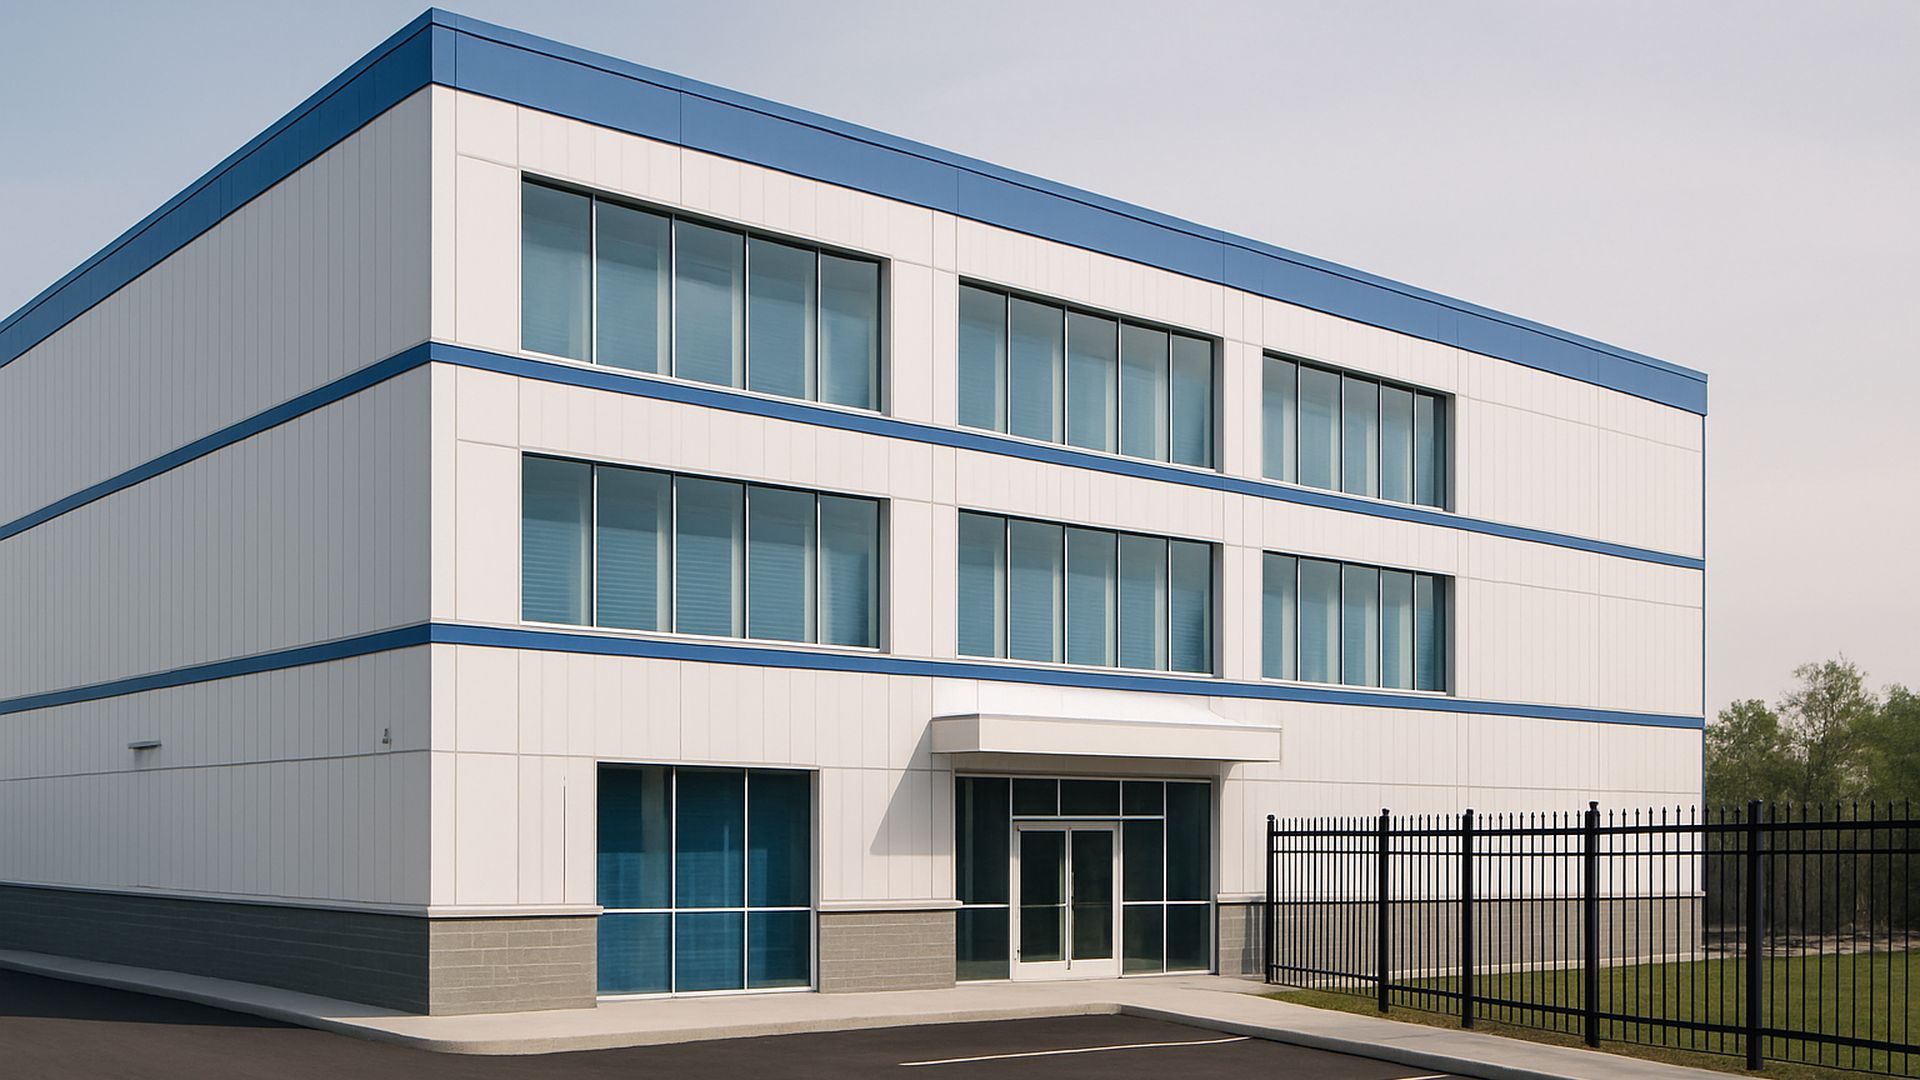
34 / STO n = Industry sources (SSA, IRS ATG)
Self-Storage
34%
MEDIAN
30-38%P50

35 / — n = Engine-modeled across standardized senior-living configurations
Senior & Assisted Living Facilities
19%
MEDIAN
12-28%P50

36 / — n = Typical market range; modeled on the multifamily component library with internal technical review & QC
Senior Apartments (55+)
%
MEDIAN
14-28%P50

37 / — n = Engine-modeled across standardized furnished short-term rental configurations
Short-Term Rentals (Airbnb, VRBO, Vacation Rentals)
30%
MEDIAN
25-35%P50

38 / — n = Typical market range; engineer-scoped by proposal
Skilled Nursing Facilities
%
MEDIAN
12-30%P50

39 / — n = Typical market range; modeled on the retail component library with internal technical review & QC
Strip & Neighborhood Centers
%
MEDIAN
12-28%P50

40 / — n = Engine-modeled across standardized veterinary configurations
Veterinary Clinics
22%
MEDIAN
8-38%P50

41 / — n = Engine-modeled across standardized warehouse configurations
Warehouses & Distribution Centers
24%
MEDIAN
10-38%P50